
Construire un portefeuille robuste : le rôle de chaque actif
Un portefeuille robuste ne cherche pas à deviner le futur. Il assemble des actifs aux rôles complémentaires pour rester viable quel que soit le régime. L'idée n'est pas d'avoir raison sur le prochain mouvement — c'est de durer. Lecture descriptive, pas un conseil.
Le problème à éviter
Beaucoup de portefeuilles sont bâtis par intuition, par mode (tech, crypto) ou par biais (« les actions montent toujours »). Le point commun : ils dépendent d'un seul scénario. Le jour où le régime change, la perte est brutale — et c'est précisément le jour où l'on a parfois besoin de son épargne.
La capacité d'un portefeuille à rester fonctionnel dans plusieurs environnements, sans dépendre d'un scénario unique. On ne maximise pas un résultat ; on évite la perte irréversible.
Le rôle de chaque actif
Plutôt que de parier sur un actif gagnant, on combine quatre rôles complémentaires. Ces rôles se lisent bien à travers le taux réel (ce que l'argent rapporte une fois l'inflation retirée).
- Actions — le moteur. La source de rendement long terme. Elles se lisent par leur tendance de marché, pas par la macro.
- Obligations — le stabilisateur. Sensibles aux taux : elles ont historiquement rendu service quand les taux baissent (ralentissement, fuite vers la sécurité), moins quand le taux réel est bas.
- Or — le relais de crise. Actif réel sans rendement : il tend à monter quand le taux réel baisse (reflation, stagflation), et c'est alors souvent le seul à tenir quand actions et obligations souffrent ensemble. À l'inverse, dans une crise déflationniste à taux réel élevé, ce sont plutôt le cash et les obligations qui tiennent — et l'or qui souffre.
- Cash — l'optionnalité. Réserve de stabilité ; historiquement le mieux placé quand le taux réel est élevé, et toujours utile en période de stress.
Aucun de ces actifs ne fonctionne tout le temps. C'est justement pour ça qu'on les tient ensemble.
Ce que ça change, en pratique
Sur vingt ans, un portefeuille diversifié à parts égales — le Browne permanent, 25 % actions / obligations / or / cash — a rendu presque autant que le tout-actions, pour un tiers de la pire chute.
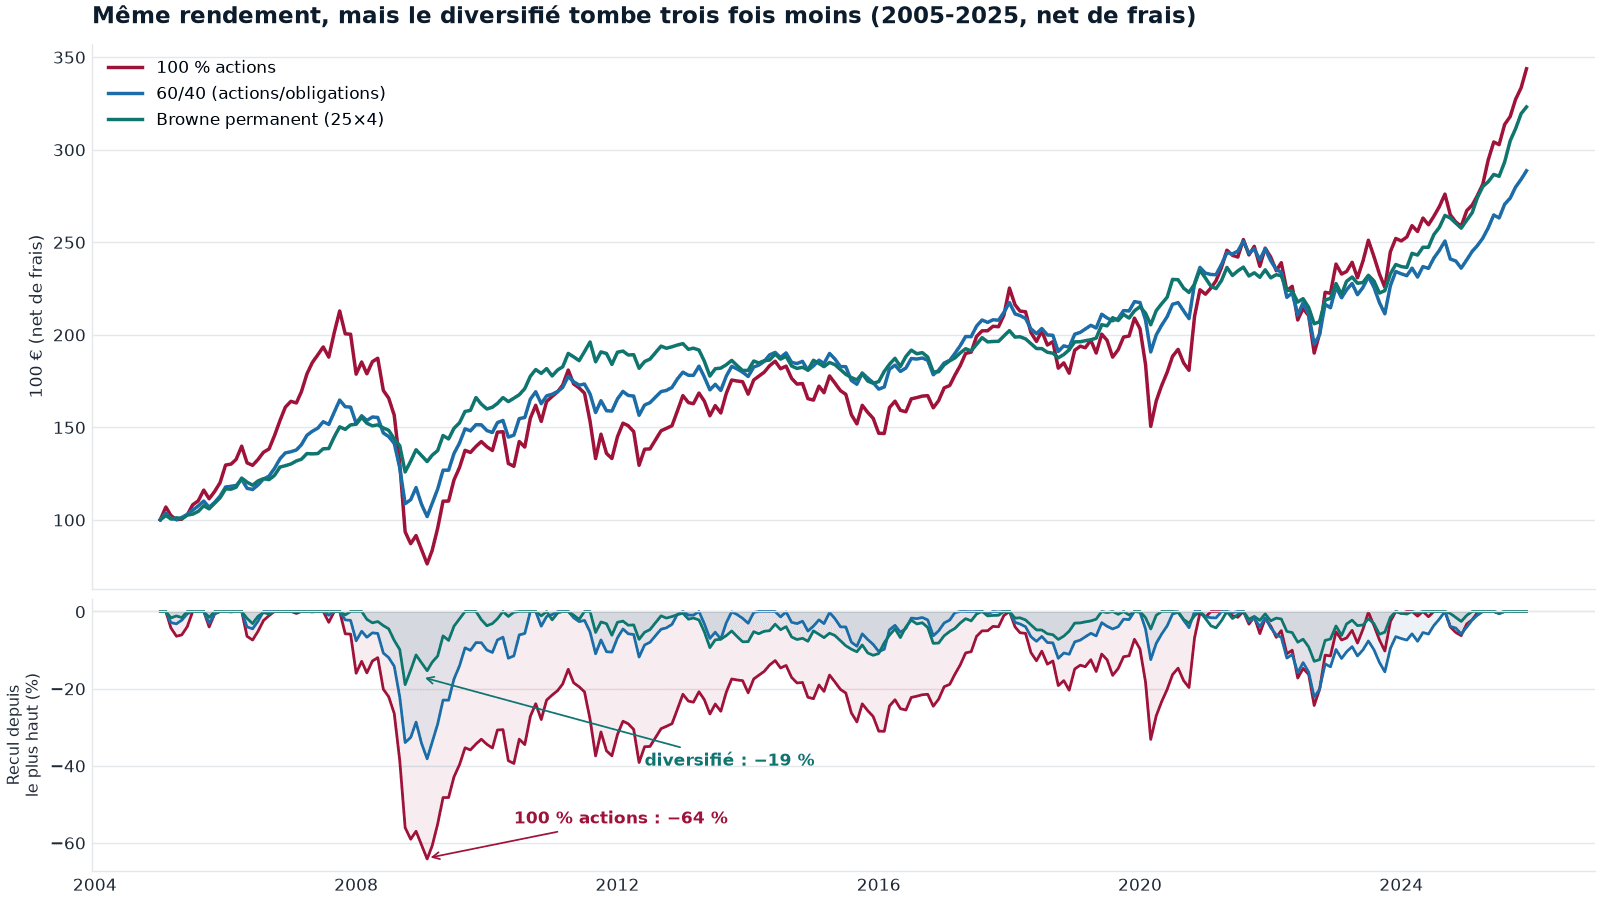
| 2005-2025, net de frais | Rendement /an | Pire chute | Sortino |
|---|---|---|---|
| 100 % actions | 6,1 % | −64 % | 0,52 |
| 60/40 (actions/obligations) | 5,2 % | −38 % | 0,69 |
| Browne permanent (25×4) | 5,8 % | −19 % | 1,24 |
Le tout-actions finit un cheveu au-dessus en rendement — mais regardez le bas du graphe : il faut traverser une chute de près des deux tiers pour y arriver. Le portefeuille diversifié abandonne une fraction de rendement et divise la pire chute par trois ; son Sortino, lui, plus que double. C'est tout le sens de « durer » : ne pas dépendre d'un seul futur, et n'être jamais forcé de vendre au pire moment.
Lire le régime, pas le prédire
Le régime du moment (taux réel haut ou bas, marché porté ou cassé) se lit dans les cours — il ne se devine pas. La page Régimes montre où l'on se situe et comment les actifs se sont comportés, historiquement, dans chaque case. C'est un cadre de lecture, pas un signal d'allocation.
Le piège du timing
Anticiper parfaitement les changements de régime est très difficile et souvent coûteux. Ce que l'approche robuste valorise — à titre descriptif, pas une consigne :
- des ajustements progressifs plutôt que des virages brutaux ;
- une diversification entre régimes plutôt qu'un pari sur un seul ;
- une réévaluation régulière (changement de régime, dérive du portefeuille).
Risques
Performance
Variable selon le régime — l'objectif est la continuité, pas le pic
Volatilité
Modérée si diversifié entre rôles
Max drawdown
Historiquement réduit vs un portefeuille 100 % actions
Un portefeuille concentré sur un seul actif peut subir des pertes lourdes lors d'un changement de régime. La robustesse vient de l'équilibre des rôles, pas du nombre de positions.
Les portefeuilles de référence
Pour situer une construction, on s'appuie sur des références pédagogiques connues — Browne Permanent (25 % actions / obligations / or / cash), Dalio All-Weather, 60/40 — chargeables comme points de départ. Ce sont des repères, pas des recommandations : ils servent à comprendre et à comparer.
Ce qu'il ne faut pas confondre
- pas une allocation personnalisée à votre situation ;
- pas une promesse de performance ;
- pas un signal d'achat ou de vente.
C'est une logique de construction : des rôles complémentaires, lus à travers le taux réel et la tendance, pour ne pas dépendre d'un seul futur.
À retenir
- Un portefeuille robuste assemble des rôles complémentaires, il ne prédit pas
- Actions = moteur, obligations = stabilisateur, or = relais quand le taux réel baisse, cash = roi de la défensive en taux réel haut
- Ces rôles se lisent à travers le taux réel ; aucun actif ne fonctionne tout le temps
- Le timing parfait est un piège : ajustements progressifs, diversification entre régimes
- L'objectif est de durer, pas de maximiser la performance ponctuelle
Pour aller plus loin
- Méthode Cap Nord — comment on lit les marchés sans les prédire.
- Construire un portefeuille — de la lecture à l'assemblage concret.
- Volatilité n'est pas risque — pourquoi durer prime sur prédire.
Découvrir la carte des régimes
Méthode. Graphe et tableau : portefeuilles de référence pédagogiques (100 % actions, 60/40, Browne permanent 25×4) reconstruits sur 2005-2025, valeurs nettes de frais, rebalancés ; « pire chute » = repli maximal du sommet au creux ; Sortino sur rendements mensuels (le tout-actions finit au-dessus en rendement, mais avec une chute bien plus profonde). Ce sont des références connues, pas des recommandations. Comportement des classes d'actifs par régime (taux réel, tendance) et séries reconstruites à partir de données publiques agrégées (Banque mondiale, BIS, séries de marché) et du pipeline interne — aucune série brute tierce reproduite. Résultats descriptifs ; le passé ne préjuge pas de l'avenir.