
Volatility vs risk: what the charts don't show
Volatility is how much a price fidgets. Risk is the loss that never comes back. They aren't the same thing — and mixing them up scares you away from good assets and reassures you about bad ones.
Two words we mistake for each other
We call "risky" whatever moves a lot, and "safe" whatever barely moves. It's a shortcut of the eye: the jumpy chart worries us, the flat one reassures us. But the eye is wrong.
How widely a price swings around its average: how far it rises and falls, and how often. A measure of restlessness, nothing more.
The probability of taking a loss you don't recover — or of taking one at the worst possible moment. It isn't the fidgeting; it's the lasting damage.
An asset can shake every day and always come back: restless, not dangerous. Another can march at a steady pace until the day it collapses and never gets up: calm, and yet deadly.
Three risks volatility can't see
- Permanent loss. Destroyed capital doesn't bounce. A stock that loses 90% then has to 10× just to get back to break-even — and volatility says nothing about that asymmetry.
- Sequence risk. It's not only how much you lose, it's when. A bad patch on the day you need your money — a purchase, an emergency, retirement — costs far more than the same loss at an indifferent moment.
- Structural fragility. A debt that swells, an imbalance that piles up, a situation that holds as long as no one looks. None of it shows in the daily fidgeting of the price — until it gives way, all at once.
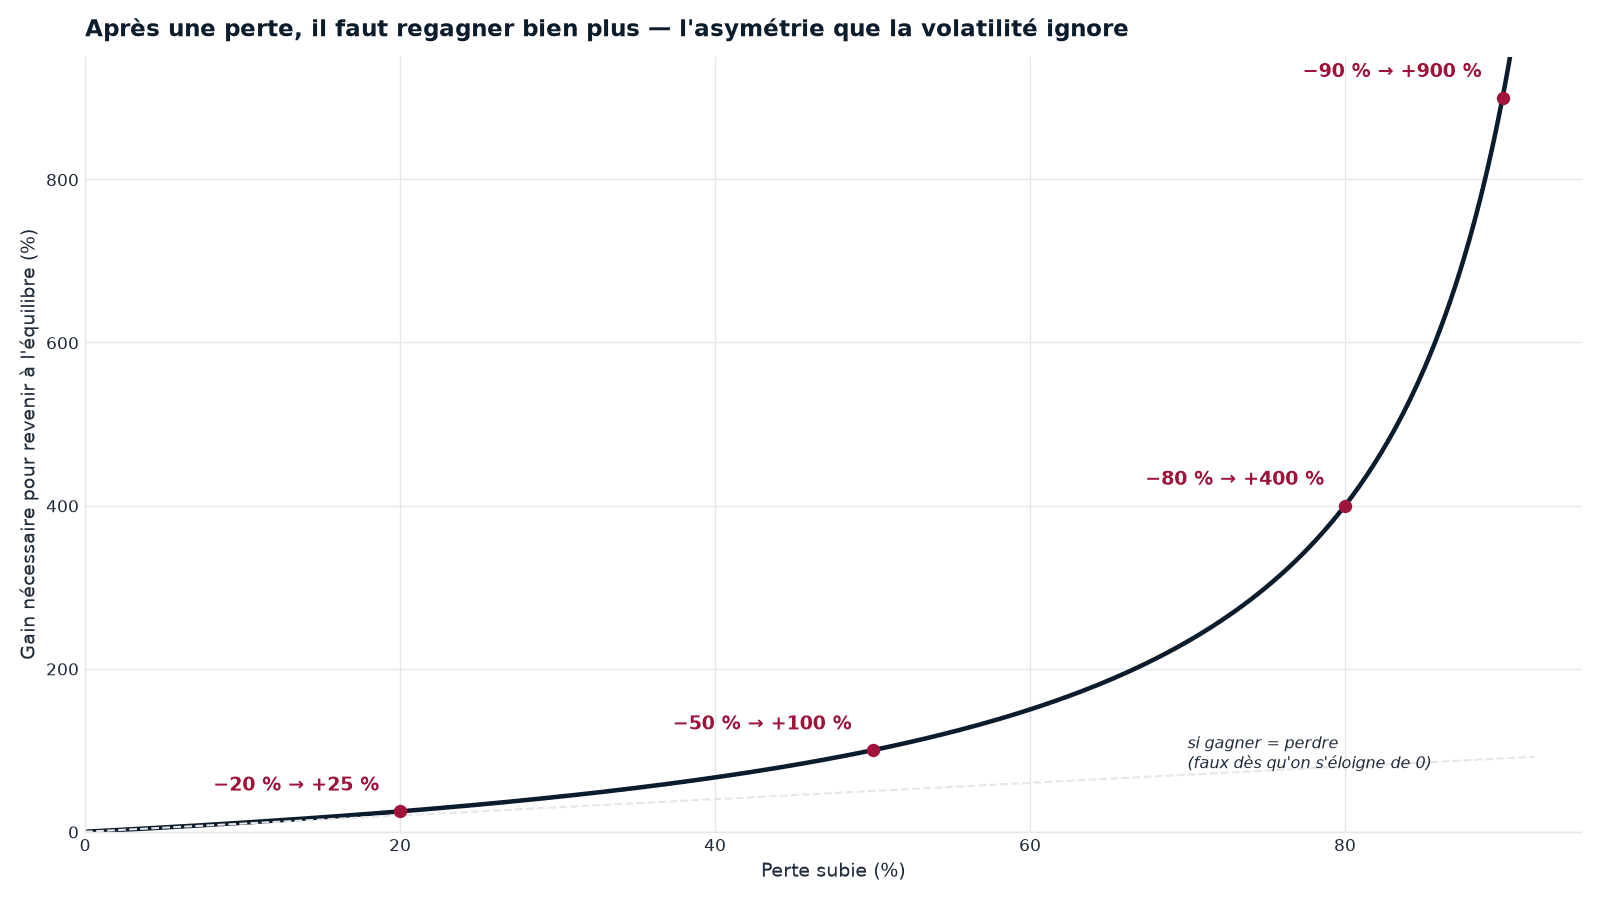
A big loss isn't recovered the way it opened up: the deeper it goes, the steeper the road back becomes. Volatility averages out the jolts and erases exactly this asymmetry — it's the drawdown, the worst decline actually lived through, that reveals it.
The chart shows the path, not the ground underfoot
A curve tells the past trajectory. It says nothing about what holds it up: the soundness of what lies beneath. A perfectly smooth line can cover mined ground; a jagged line can rest on bedrock. Reading risk from the shape of the curve alone is mistaking the surface for the structure.
The worst fall taken between a peak and the trough that follows. Where average volatility smooths everything away, the drawdown shows the worst moment actually lived through — often more telling for whether you'd have held on.
So to judge a risk, you look beyond the fidgeting: the maximum loss already absorbed, the regime you're in, and the price paid to get in.
What it changes for a portfolio
Implication pour l'allocation
A robust allocation doesn't try to remove the jolts. It tries to avoid the loss you don't come back from. Apparent stability isn't safety; the structure matters more than the smooth line.
Takeaways
- Volatility measures the fidgeting; risk is the loss that doesn't come back.
- A calm asset can be fragile, a jumpy asset can be robust.
- Volatility ignores permanent loss, sequence risk, and underlying fragility.
- You read risk beyond the curve: maximum loss, regime, valuation.
Go further
- The Cap Nord method — reading markets without predicting them.
- Building a robust portfolio — the role of each asset.
- Base 100: reading a chart without being fooled — the other trap of the curve.
See regimes by country
An educational distinction between volatility (a measure of restlessness) and risk (lasting loss, sequence, structural fragility). The chart is an arithmetic illustration: the break-even gain equals loss ÷ (1 − loss), independent of any asset — it's not a backtest. Cap Nord analysis — descriptive, not investment advice.