
Ichimoku on the Test Bench
I spent years on Ichimoku. Its five lines, its cloud, its flats. Then I ran the honest numbers, across several decades of data. What works is simple, free, and doesn't sell. A descriptive read — not advice.
I believed in the cloud
Ichimoku is beautiful. Five lines, a cloud that shades in, a "lagging span" hovering below price. In plain terms: a set of five lines drawn over the price chart, meant to tell you when to buy and when to sell. The most widely taught trading method in France. You're promised it "frames the market," that it reveals the "critical levels" ordinary eyes miss.
I believed it. I read the books, drew the flats, watched for the crossovers. Then one question started to nag: does it actually work? Not "does it look like it works on yesterday's chart." Does it, applied mechanically over decades, beat simply staying invested?
I coded the method. I ran it over several decades of index data, across several countries. Here's what the numbers say.
The win rate proves nothing
First, the measure. The courses talk about a "win rate": the share of winning trades. That's the casino's metric — reassuring and empty.
A system that wins four times out of ten can be highly profitable if the gains dwarf the losses. A system that wins two times out of three can wipe you out if the rare losses are enormous. The share of winning trades says nothing about what matters: net expectancy — what it truly earns on average, once costs are paid.
A score: it measures what you earn against the downside alone — the pain that makes you sell at the worst moment. The higher the number, the better: in practice, below ~0.3 the return pays poorly for the jolts, around 0.8 and above it's solid. We watch it instead of the "win rate."
So we judge differently: what the capital actually returns, the depth of the worst fall, the time spent underwater before breaking even, and the Sortino. Net of costs. Always against the honest benchmark — buy the index and hold it, dividends included.
Two rules, one market
Here are the two approaches, plotted on the same index over the same period — the S&P 500.
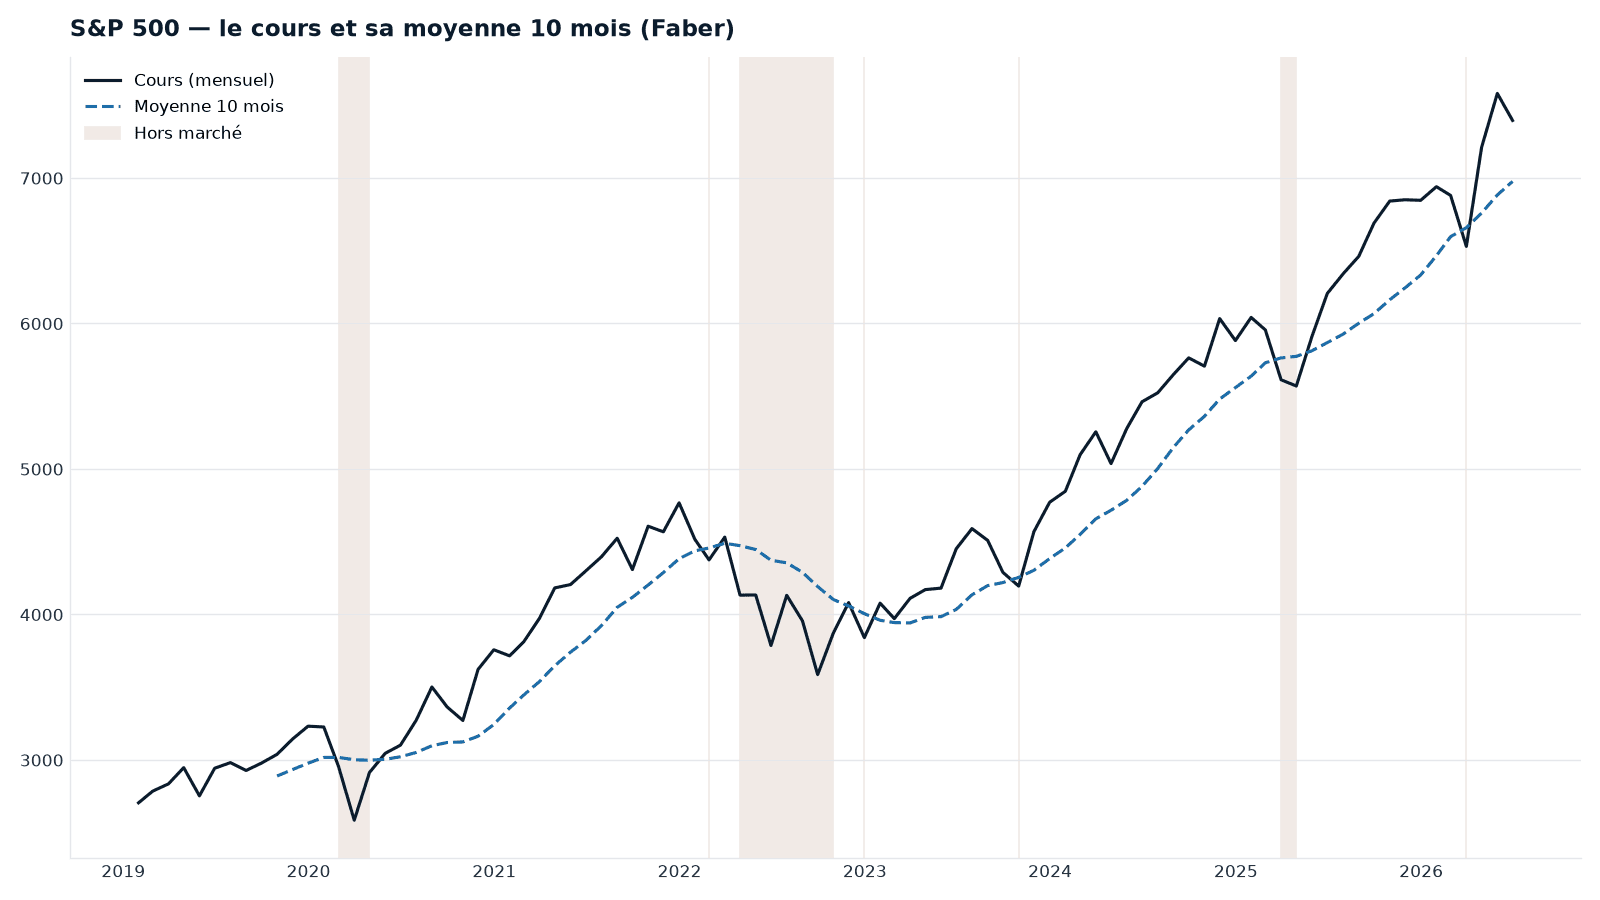
On one side, a rule you can state in a single sentence: stay invested as long as price holds above its moving average — its underlying trend, the average price of the past months. Above, you take it as rising; below, you step out.
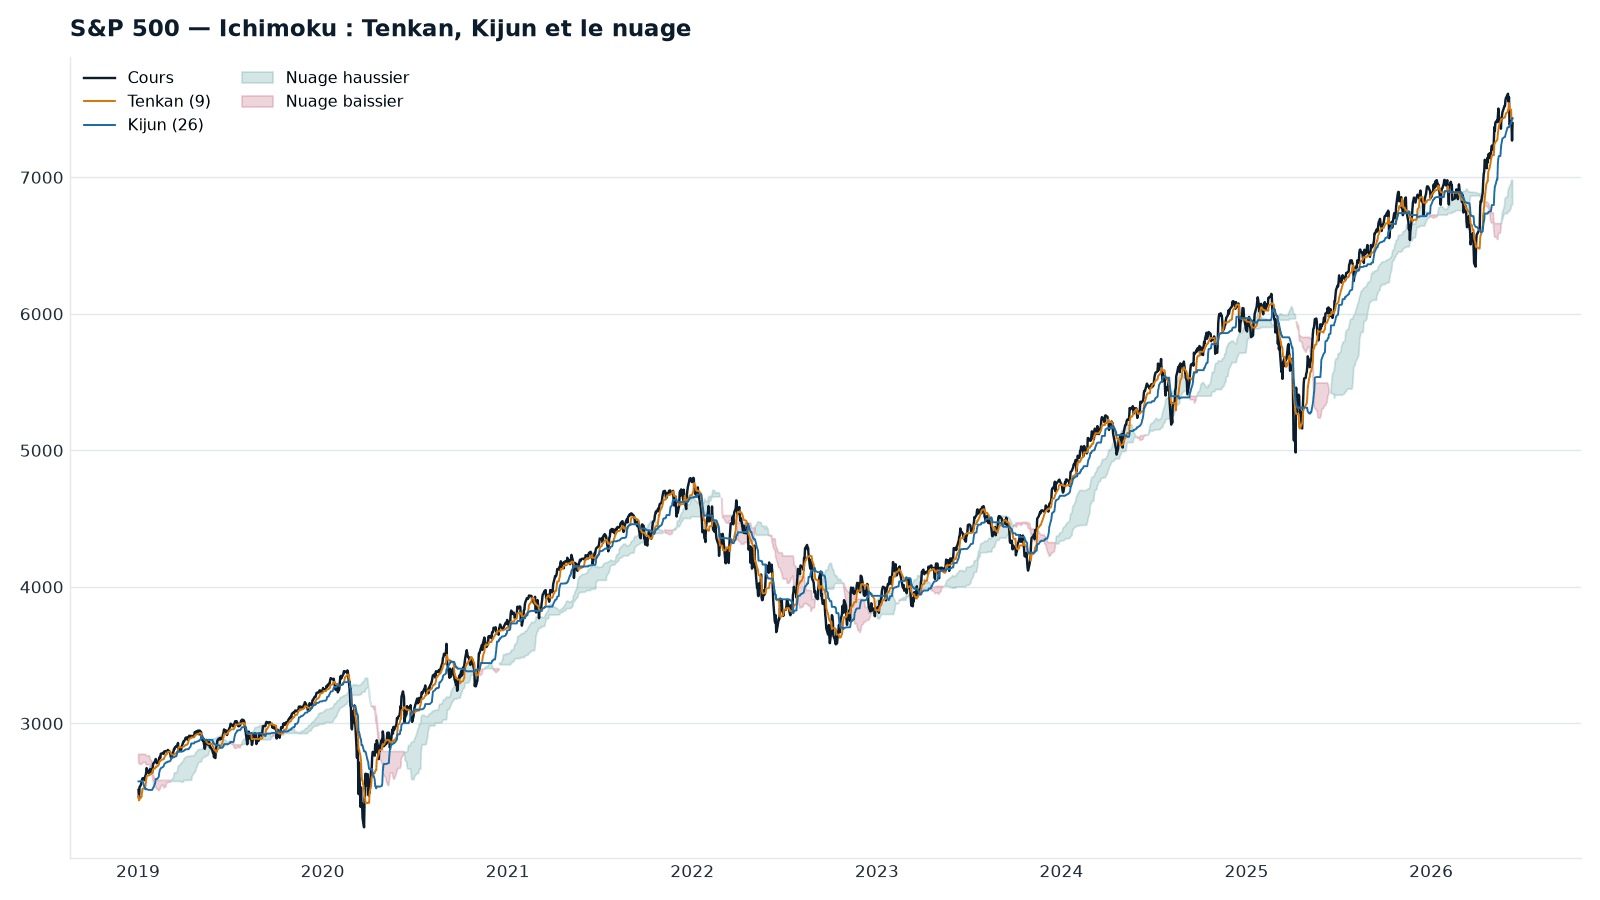
On the other, a dashboard: five lines, a cloud that shades in, crossovers, "flats." Intuition says the second, being richer, must frame the market better. The test bench says the opposite.
Onto the test bench
I ran both rules mechanically on the S&P 500 since 2000, net of transaction costs. One hundred euros to start, and here's the path each one took.
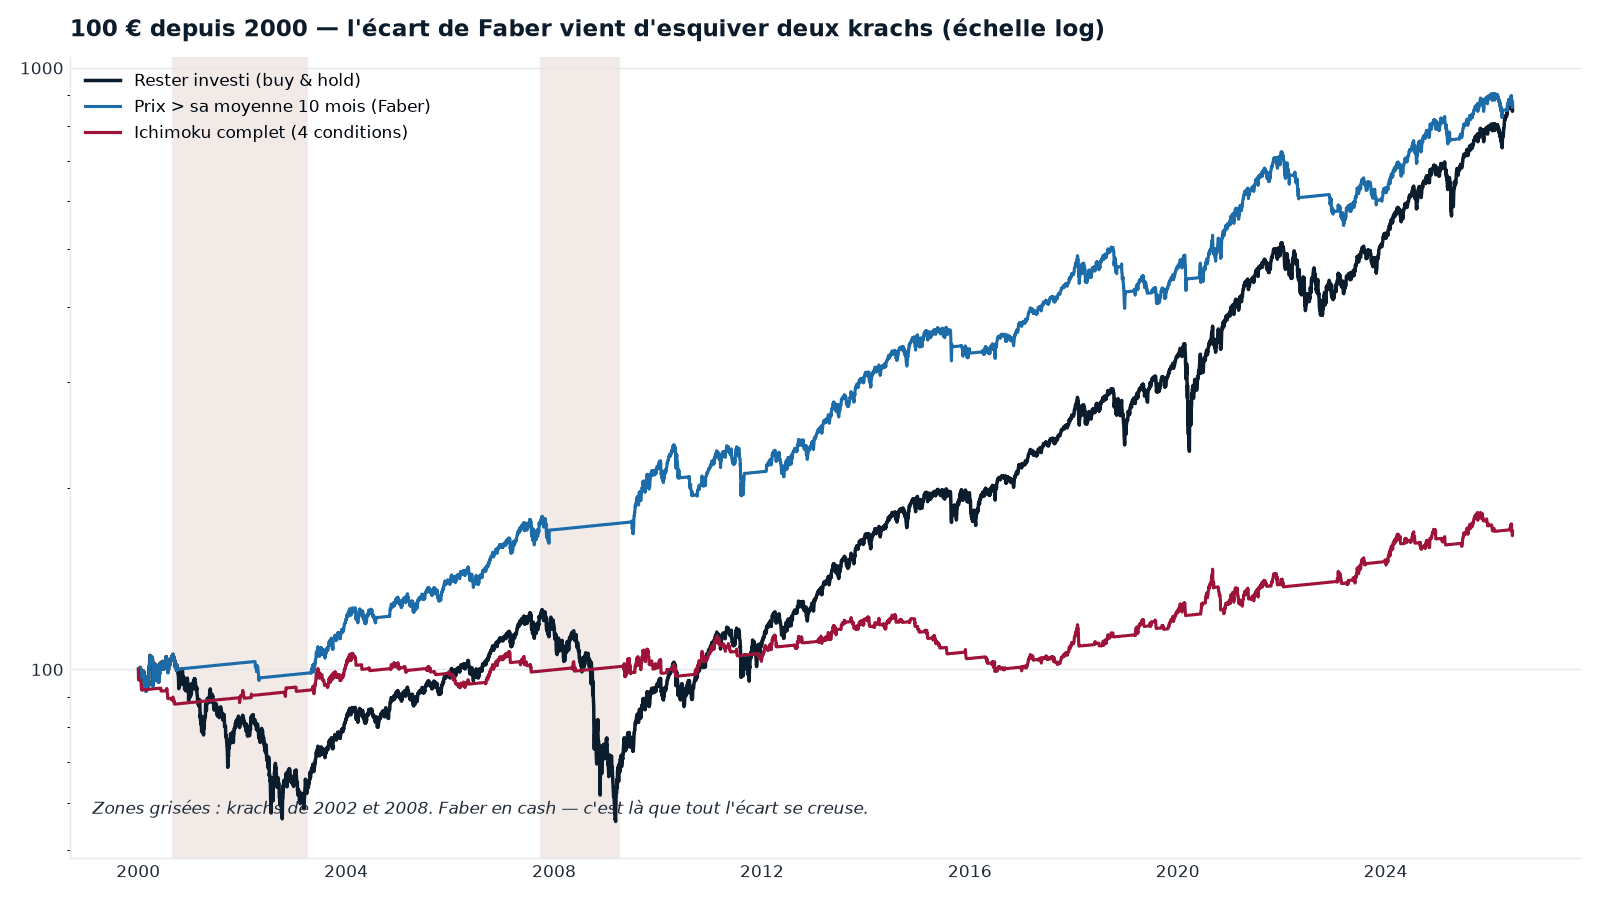
The same trajectories, in numbers — the annualized return, the worst fall endured (how far capital melted, peak to trough) and the Sortino:
| System — S&P 500, 2000-2026 | Return /yr | Worst fall | Sortino |
|---|---|---|---|
| Stay invested (buy & hold) | 8.5% | −56% | 0.66 |
| Price > its 10-month average (Faber) | 8.5% | −25% | 0.82 |
| Full Ichimoku (4 conditions) | 2.0% | −20% | 0.25 |
The simplest filter returns as much as "stay invested" — while halving the worst fall. Better, then, once risk is priced in. Ichimoku in all its sophistication returns only a quarter of the rest: its worst fall is small because it spends most of its time out of the market, catching nothing — not because it aims true.
This elementary filter has a name. Faber (Meb Faber, U.S. fund manager): you compare price to its ten-month average and stay invested as long as it's above. Published, free, boring.
Over the long run, the gap widens
The curve above actually flatters the filter: starting just before a crash mechanically favors rules that dodge it. The real test is the long run. Let's stretch to thirty-six years and all four indices — no chart this time, just the numbers.
| Index — 1990-2026 | System | Return /yr | Worst fall |
|---|---|---|---|
| CAC 40 | Stay invested | 7.2% | −63% |
| Faber | 5.9% | −30% | |
| Full Ichimoku | 1.4% | −25% | |
| S&P 500 | Stay invested | 10.8% | −56% |
| Faber | 9.3% | −25% | |
| Full Ichimoku | 2.5% | −20% | |
| Nasdaq | Stay invested | 12.8% | −77% |
| Faber | 11.0% | −51% | |
| Full Ichimoku | 7.6% | −20% | |
| DAX | Stay invested | 7.4% | −73% |
| Faber | 7.5% | −32% | |
| Full Ichimoku | 2.3% | −29% |
Across thirty-six years and four markets, two things emerge. First, full Ichimoku never catches up: everywhere it returns only a fraction of "stay invested" — 2.5% against 10.8% on the S&P — and the gap only grows as time passes and markets climb, because every year spent out of the market costs a little more. Second, and more awkward for the simple filter itself: over this span, it no longer beats the return of "stay invested" — it matches it at best, cedes ground more often. It only keeps halving the worst fall.
So the robust lesson fits in one sentence: even the best timing system doesn't earn more over the long run; at best, it falls less hard. And Ichimoku is no isolated case.
Sophistication that costs
We put the other stars through the same bench: RSI, stochastics, MACD, Bollinger bands, Supertrend — other popular technical indicators, each with its own buy-and-sell recipe. The verdict repeats.
Trend-following indicators roughly hold up. Everything else disappoints. And the "buy the oversold" family — the idea that an asset has dropped too far and is bound to bounce — is frankly destructive: mid-crash, "oversold" means catching a falling knife. The worst collapses in the whole study come from there.
RSI captures the irony. Used as a trend filter, it does its job honestly. Used the way it's sold — buy when it's "oversold" — it's a disaster. The indicator only pays in the use nobody sells.
As for Ichimoku's "flats," those horizontal levels supposed to pull price toward them: we measured. At any moment, there are always several within reach, across several time frames. A perfectly random path produces just as many. You can always, after the fact, point to the flat that "worked"; beforehand, the method names none. It's not that it loses — it's that it states nothing testable.
Tax finishes what was left
One last wall remains, the sturdiest. Tax.
A system that moves in and out realizes its gains — and every realized gain is taxed. The one who buys and holds pays only at the end, once. On an ordinary brokerage account (compte-titres), that gap alone is enough to erase the thin edge that survived on paper. "Always invested" pulls back ahead.
The irony is complete: the only ground where you can truly automate active trading — the brokerage account, the one where you can borrow to bet bigger or bet on the downside — is also the one where the tax on churn bites hardest.
So where's the edge?
If an edge survives anywhere, it isn't in the spectacular trigger. It's in the slow, boring, hard-to-broadcast part: exposure held while the trend carries, protection when it breaks, few gains realized — so little tax. Nothing you can sell on a monthly subscription.
It's an inconvenient result for anyone selling methods. A genuine short-term signal is fragile: broadcast to a thousand subscribers who pile into the same entry, it fades out. What truly works destroys itself the moment it's sold. And the "monthly subscription" format, by construction, tends to select for the absence of an edge.
What this reading does not do
It doesn't predict the markets. It doesn't claim no human wins by trading — some do, through risk management and discipline, never through the indicator alone. It recommends no purchase, no sale, no allocation. These are historical results, on fixed rules not optimized after the fact, with conventional thresholds. The past guarantees nothing here.
Takeaways
- The "win rate" is the casino's metric: it says nothing about net expectancy.
- Over several decades, Ichimoku in all its sophistication did not beat simply staying invested — and every added layer stripped out value.
- The signal that holds is the crudest: price against its average (Faber).
- Tax on churn erases the little that survived on paper.
- What works is simple, slow, and doesn't sell.
Go further
- The Cap Nord Manifesto — invest to endure, not to be right.
- The Cap Nord method — read the markets without predicting them.
- Volatility is not risk — why enduring beats predicting.
Discover Cap Nord
Method. Four equity indices (CAC, S&P 500 — shown —, Nasdaq, DAX), 2000-2026 period, daily quotes from Cap Nord's internal pipeline built on public sources; index backfill prior to inception is excluded. "Stay invested" is computed with dividends reinvested. Causal signals — known at the close, executed the next day — net of transaction costs, out-of-market position earning 2%. Sortino: return against downside only (MAR = 0), annualized. Rules tested: Ichimoku 9/26/52 in full alignment of the four objective conditions; the "Faber" filter = monthly price above its ten-month average (Meb Faber, published). Historical, descriptive results, on fixed rules not optimized after the fact; the past does not predict the future. No buy, sell, or allocation recommendation.