
Building a robust portfolio: the role of each asset
A robust portfolio doesn't try to guess the future. It assembles assets with complementary roles so it stays viable whatever the regime. The point isn't to be right about the next move — it's to endure. A descriptive reading, not advice.
The problem to avoid
Plenty of portfolios are built on gut feel, on fashion (tech, crypto), or on bias ("stocks always go up"). What they share: they hinge on a single scenario. The day the regime turns, the loss is brutal — and that's often the very day you need your savings.
A portfolio's ability to keep working across several environments, without depending on a single scenario. You don't maximize an outcome; you avoid the irreversible loss.
The role of each asset
Rather than bet on one winning asset, you combine four complementary roles. These roles read clearly through the real rate (what money earns once inflation is stripped out).
- Equities — the engine. The source of long-term return. They read through their market trend, not through macro.
- Bonds — the stabilizer. Sensitive to rates: historically they've earned their keep when rates fall (slowdown, flight to safety), less so when the real rate is low.
- Gold — the crisis relay. A real asset with no yield: it tends to rise when the real rate falls (reflation, stagflation), and that's when it's often the only one left standing while equities and bonds suffer together. Conversely, in a deflationary crisis with a high real rate, it's cash and bonds that hold — and gold that suffers.
- Cash — the optionality. A reserve of stability; historically best placed when the real rate is high, and always useful under stress.
None of these assets works all the time. That's exactly why you hold them together.
What it changes, in practice
Over twenty years, an equally weighted diversified portfolio — the Browne Permanent, 25% equities / bonds / gold / cash — returned almost as much as all-equities, for a third of the worst drawdown.
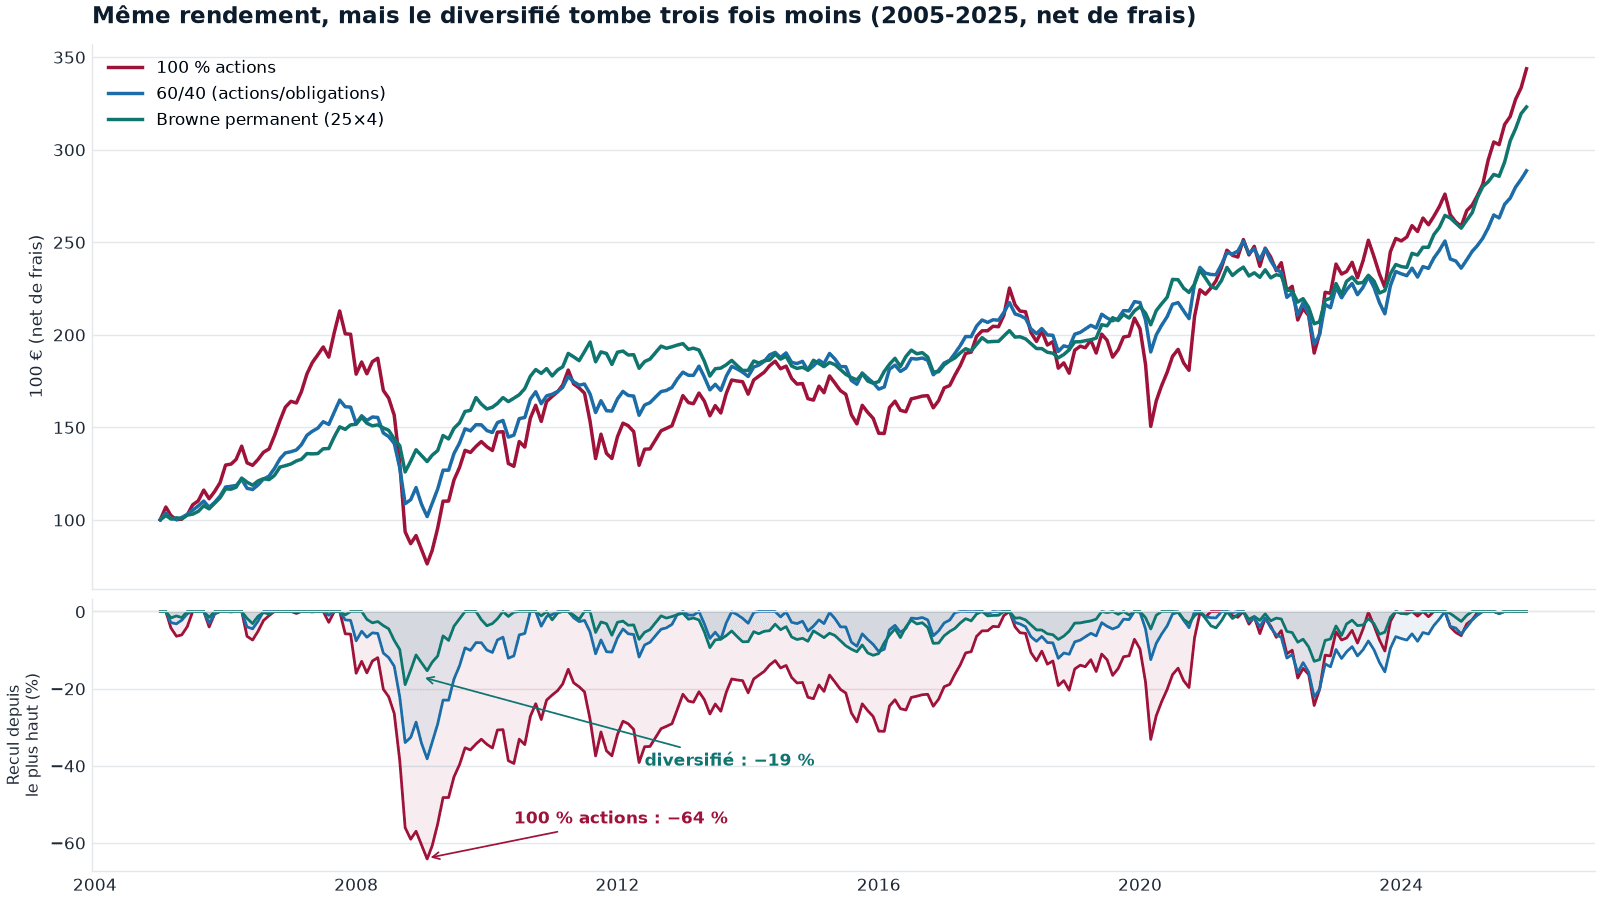
| 2005-2025, net of fees | Return /yr | Worst drawdown | Sortino |
|---|---|---|---|
| 100% equities | 6.1% | −64% | 0.52 |
| 60/40 (equities/bonds) | 5.2% | −38% | 0.69 |
| Browne Permanent (25×4) | 5.8% | −19% | 1.24 |
All-equities ends a hair ahead on return — but look at the bottom of the chart: getting there means living through a drop of nearly two-thirds. The diversified portfolio gives up a sliver of return and cuts the worst drawdown to a third; its Sortino, meanwhile, more than doubles. That's the whole meaning of "enduring": not depending on a single future, and never being forced to sell at the worst moment.
Read the regime, don't predict it
The current regime (real rate high or low, market carried or broken) is read from prices — it isn't guessed. The Regimes page shows where we stand and how assets have behaved, historically, in each cell. It's a reading frame, not an allocation signal.
The timing trap
Timing regime changes perfectly is very hard and often costly. What the robust approach values — as description, not instruction:
- gradual adjustments rather than abrupt turns;
- diversification across regimes rather than a bet on one;
- regular reassessment (regime change, portfolio drift).
Risques
Performance
Variable by regime — the goal is continuity, not the peak
Volatilité
Moderate when diversified across roles
Max drawdown
Historically reduced vs a 100% equities portfolio
A portfolio concentrated on a single asset can take heavy losses when the regime turns. Robustness comes from the balance of roles, not the number of positions.
The reference portfolios
To place a construction, we lean on well-known teaching references — Browne Permanent (25% equities / bonds / gold / cash), Dalio All-Weather, 60/40 — loadable as starting points. They're reference points, not recommendations: they're there to understand and compare.
What not to confuse it with
- not a personalized allocation for your situation;
- not a promise of performance;
- not a buy or sell signal.
It's a construction logic: complementary roles, read through the real rate and the trend, so you don't depend on a single future.
Takeaways
- A robust portfolio assembles complementary roles; it doesn't predict
- Equities = engine, bonds = stabilizer, gold = relay when the real rate falls, cash = king of defense when the real rate is high
- These roles read through the real rate; no asset works all the time
- Perfect timing is a trap: gradual adjustments, diversification across regimes
- The goal is to endure, not to maximize one-off performance
Go further
- The Cap Nord method — how we read markets without predicting them.
- Building a portfolio — from reading to concrete assembly.
- Volatility is not risk — why enduring beats predicting.
Explore the regime map
Method. Chart and table: educational reference portfolios (100% equities, 60/40, Browne Permanent 25×4) rebuilt over 2005-2025, values net of fees, rebalanced; "worst drawdown" = maximum peak-to- trough decline; Sortino on monthly returns (all-equities ends ahead on return, but with a far deeper drawdown). These are well-known references, not recommendations. Asset-class behavior by regime (real rate, trend) and series rebuilt from aggregated public data (World Bank, BIS, market series) and the internal pipeline — no raw third-party series reproduced. Descriptive results; the past does not prejudge the future.