
Macro Regimes: How to Read the Asset Matrix
Cap Nord's matrix doesn't cross inflation with growth. It crosses the two axes that actually sort assets: the real rate (which separates the defensive holdings) and the market trend (which governs equities). Here's how it reads, what it shows — and what it doesn't do.
Neither growth nor inflation imposed
Because that grid, imposed up front, fails to sort what it claims to — we checked it under test. The detail is in why the classic grid falls short. So we keep a matrix, but one built on what the data actually separates.
The two axes that sort
The interest rate once inflation is stripped out — what money truly earns. It sets gold against financial assets: when it's low, gold gains relative appeal; when it's high, financial assets take back the edge. It's a level that sorts the defensives, not a forecast.
A market's price against its long moving average (ten months): above it, the market is carried; below it, it's broken. Equities read by this trend, not by macro.
- Axis 1 — the real rate cleanly separates the defensive holdings (gold, bonds, cash).
- Axis 2 — the trend governs equities, which macro doesn't sort.
Cross the two and you get four cells — not decreed, but kept because they hold up under test (and readable across the long history, back to the 1880s in the deep markets).
How the matrix reads
Each cell shows the historical behavior of assets, across three complementary measures:
Quick read: locate the current regime (real rate high/low × market carried/broken), then look at what has historically dominated in that cell. The Sortino shows, for instance, that gold dominates the defensive holdings when the real rate is low, and that cash dominates them when the real rate is high.
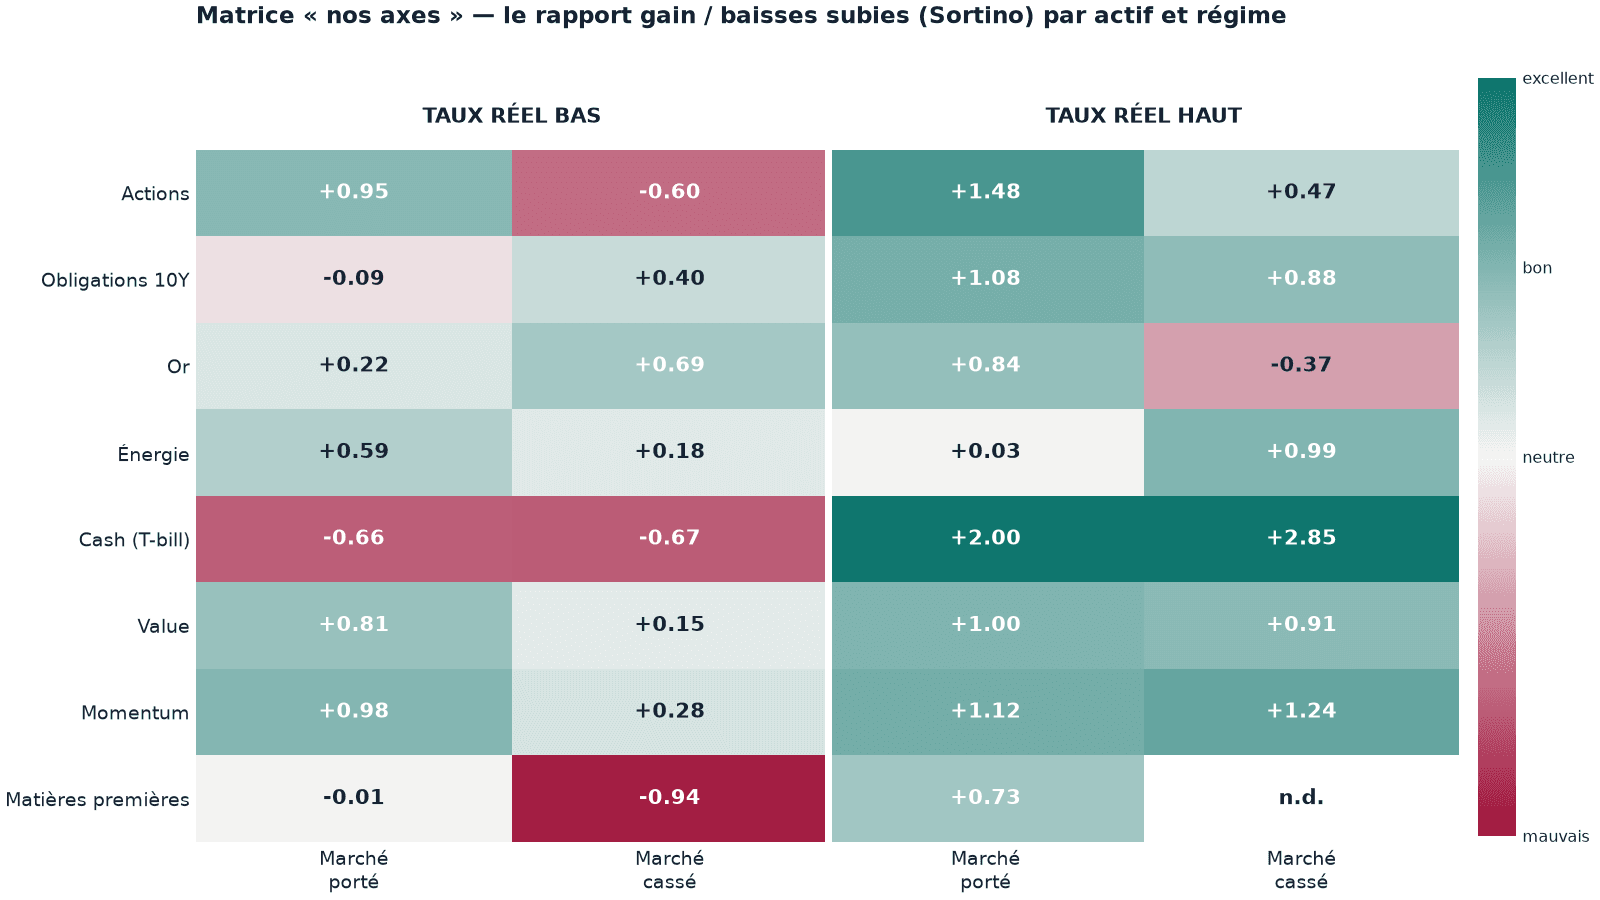
The switch reads at a glance. Cash is the worst choice when the real rate is low (−0.66) and the best refuge when it's high (+2.00 to +2.85 — it barely falls); gold does the opposite, prized when the real rate is low. Equities, for their part, don't hinge on the real rate but on the trend: firmly green when the market is carried, far paler when it's broken. Macro doesn't sort them; their trend does.
In real return — in purchasing power — the defensive holdings tell the same story:
| Defensive holdings — real return / yr | Low rate · carried | low · broken | high · carried | high · broken |
|---|---|---|---|---|
| Gold | +2.2% | +7.5% | +9.0% | −3.4% |
| 10Y bonds | −0.5% | +1.9% | +4.7% | +3.9% |
| Cash (T-bill) | −1.1% | −1.2% | +1.5% | +1.6% |
What the page adds
The matrix above is a snapshot. The interactive Regimes page goes further:
- The full "our axes" matrix — the three measures (CAGR / Sortino / MDD) per asset and per cell, with a nominal-or-real toggle.
- The historical chart — the long performance of assets (base 100), regimes as background bands and crises marked, to see when we shifted from one cell to another.
What this reading is not
- not a trading signal, not a forecast;
- not personalized allocation advice;
- not a promise: past behavior by regime guarantees nothing.
It's a descriptive reading frame: locating the context and the historical behavior of assets, so you decide with a frame rather than with an emotion.
Takeaways
- The matrix crosses the real rate with the market trend, not inflation with growth
- The real rate separates the defensive holdings; the trend governs equities
- Each cell reads across three measures: CAGR, Sortino, maximum drawdown
- The cells are kept because they hold up under test, not decreed up front
- A descriptive, historical reading — never a signal or advice
Go further
- The Cap Nord method — how we read the markets without predicting them.
- Why the classic grid falls short — the critique of the growth × inflation quadrants.
- Volatility is not risk — why losses matter more than the jolts.
Explore the regime map
Method. A descriptive matrix measured in USD (United States, eight assets, 1871-2026). Causal axes, known as of the date: real rate = sign of the real 10-year rate against its long average (high/low); trend = equities above/below their ten-month average (carried/broken), lagged one month. Ranked by real Sortino (return set against downside only, threshold = preservation of purchasing power); returns deflated by inflation. Matrix derived by induction from public data (World Bank indicators, BIS, long market series) transformed by the internal pipeline — no third-party raw series reproduced. Historical and descriptive results; the past does not prejudge the future.